Local Impact: How is Collingswood Affected?
Every year since 2013, Collingswood has raised less in school property taxes than the calculated Local Fair Share.
In 2024-25, Collingswood’s Local Fair Share increased by 10%, far above the 2% school tax cap.
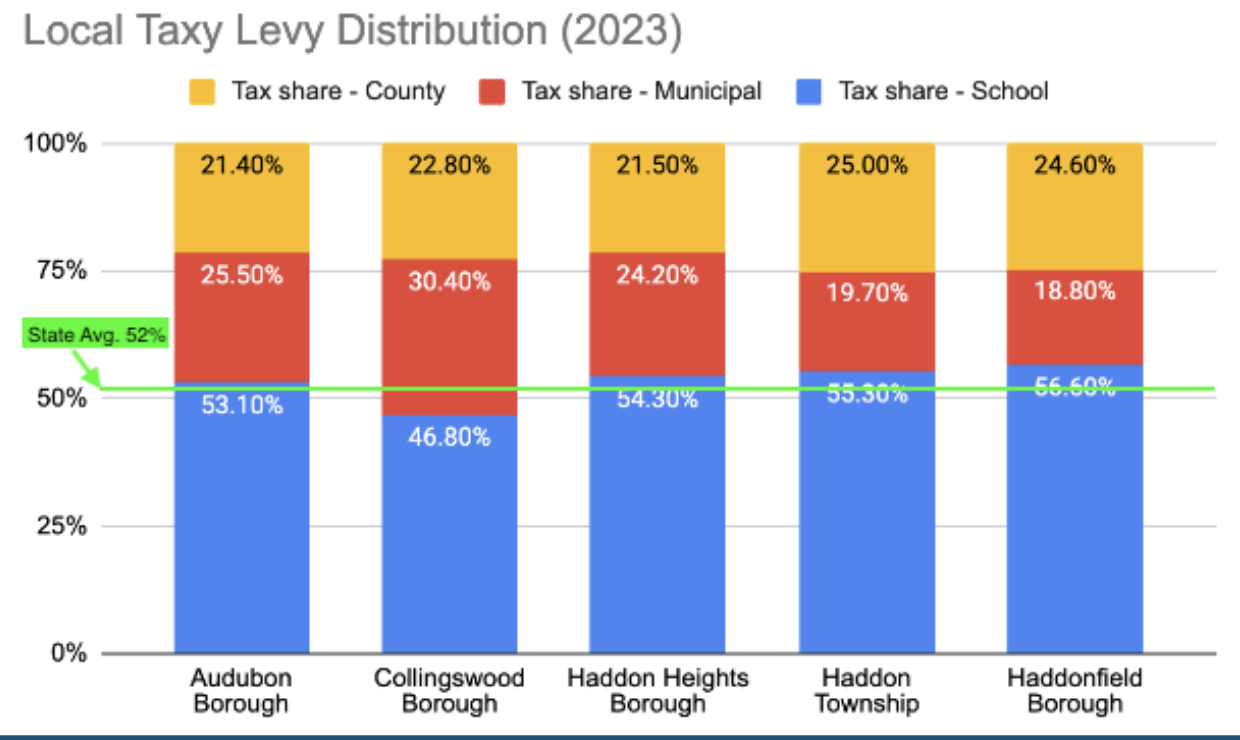
On average in Collingswood, 47% of the general real estate taxes collected are allocated for schools. This is well below the state average of 52% and below nearly every surrounding, similarly sized school district.
It should be noted, as it is throughout our site, social media posts, and newsletters, that the schools determine the total amount of collected school tax, not the municipality. The municipality keeps their share of the local tax levy, sends a portion to the county, and a portion to the schools. The amount going to schools is determined by the district.
However, the municipalities are able to legally send funds from their portion of collected local taxes to the school district in addition to their mandated collection of school tax. You can find more about this on our Solutions page.
The below table shows our year over year local real estate tax, the percentage that goes to our school district, and a comparison against the state average percentage going to districts. This table clearly outlines our district is underfunded at the local level. Please note that the School Tax Levy column includes existing school district debt service and a 10% contribution from PILOTs.
|
Year |
Total Tax Levy |
% School |
School Tax Levy |
School Tax Rate Change From Prev. Year |
School Tax Rate |
@ State Avg (52%) |
Difference |
|---|---|---|---|---|---|---|---|
|
2024 |
$42,930,467 |
46.71% |
$20,054,703 |
3.91% |
1.86 |
$22,753,147.51 |
$2,698,444.34 |
|
2023 |
$41,126,148 |
46.80% |
$19,247,037 |
2.87% |
1.79 |
$21,796,858.44 |
$2,549,821.18 |
|
2022 |
$39,989,465 |
46.70% |
$18,675,080 |
0.40% |
1.74 |
$21,194,416.45 |
$2,519,336.30 |
|
2021 |
$39,319,016 |
47.20% |
$18,558,576 |
2.48% |
1.733 |
$20,839,078.48 |
$2,280,502.93 |
|
2020 |
$38,297,402 |
47.10% |
$18,038,076 |
4.32% |
1.691 |
$20,297,623.06 |
$2,259,546.72 |
|
2019 |
$37,424,084 |
46.20% |
$17,289,927 |
1.89% |
1.621 |
$19,834,764.52 |
$2,544,837.71 |
|
2018 |
$37,043,264 |
45.80% |
$16,965,815 |
2.05% |
1.591 |
$19,632,929.92 |
$2,667,115.01 |
|
2017 |
$36,423,008 |
45.50% |
$16,572,469 |
3.52% |
1.559 |
$19,304,194.24 |
$2,731,725.60 |
|
2016 |
$35,458,518 |
45.10% |
$15,991,792 |
3.93% |
1.506 |
$18,793,014.54 |
$2,801,222.92 |
|
2015 |
$34,481,176 |
44.70% |
$15,413,086 |
2.91% |
1.449 |
$18,275,023.28 |
$2,861,937.61 |
As operating costs continue to increase, the district must bring in additional revenue. Without additional revenue, the following could very well be at stake:
- Fairly compensated staff - The staff of Collingswood Public Schools have been underfunded for a very, very long time. It's true compared to the entire state of New Jersey and nearly every surrounding, similarly sized school district.
- Build upon existing youth programs - Without additional revenue, youth programs will either continue to stay flat or reduce in offerings over time. This is unacceptable.
- Plan for future growth - Without having predictability in future revenue, it is nearly impossible to appropriately plan for future growth.